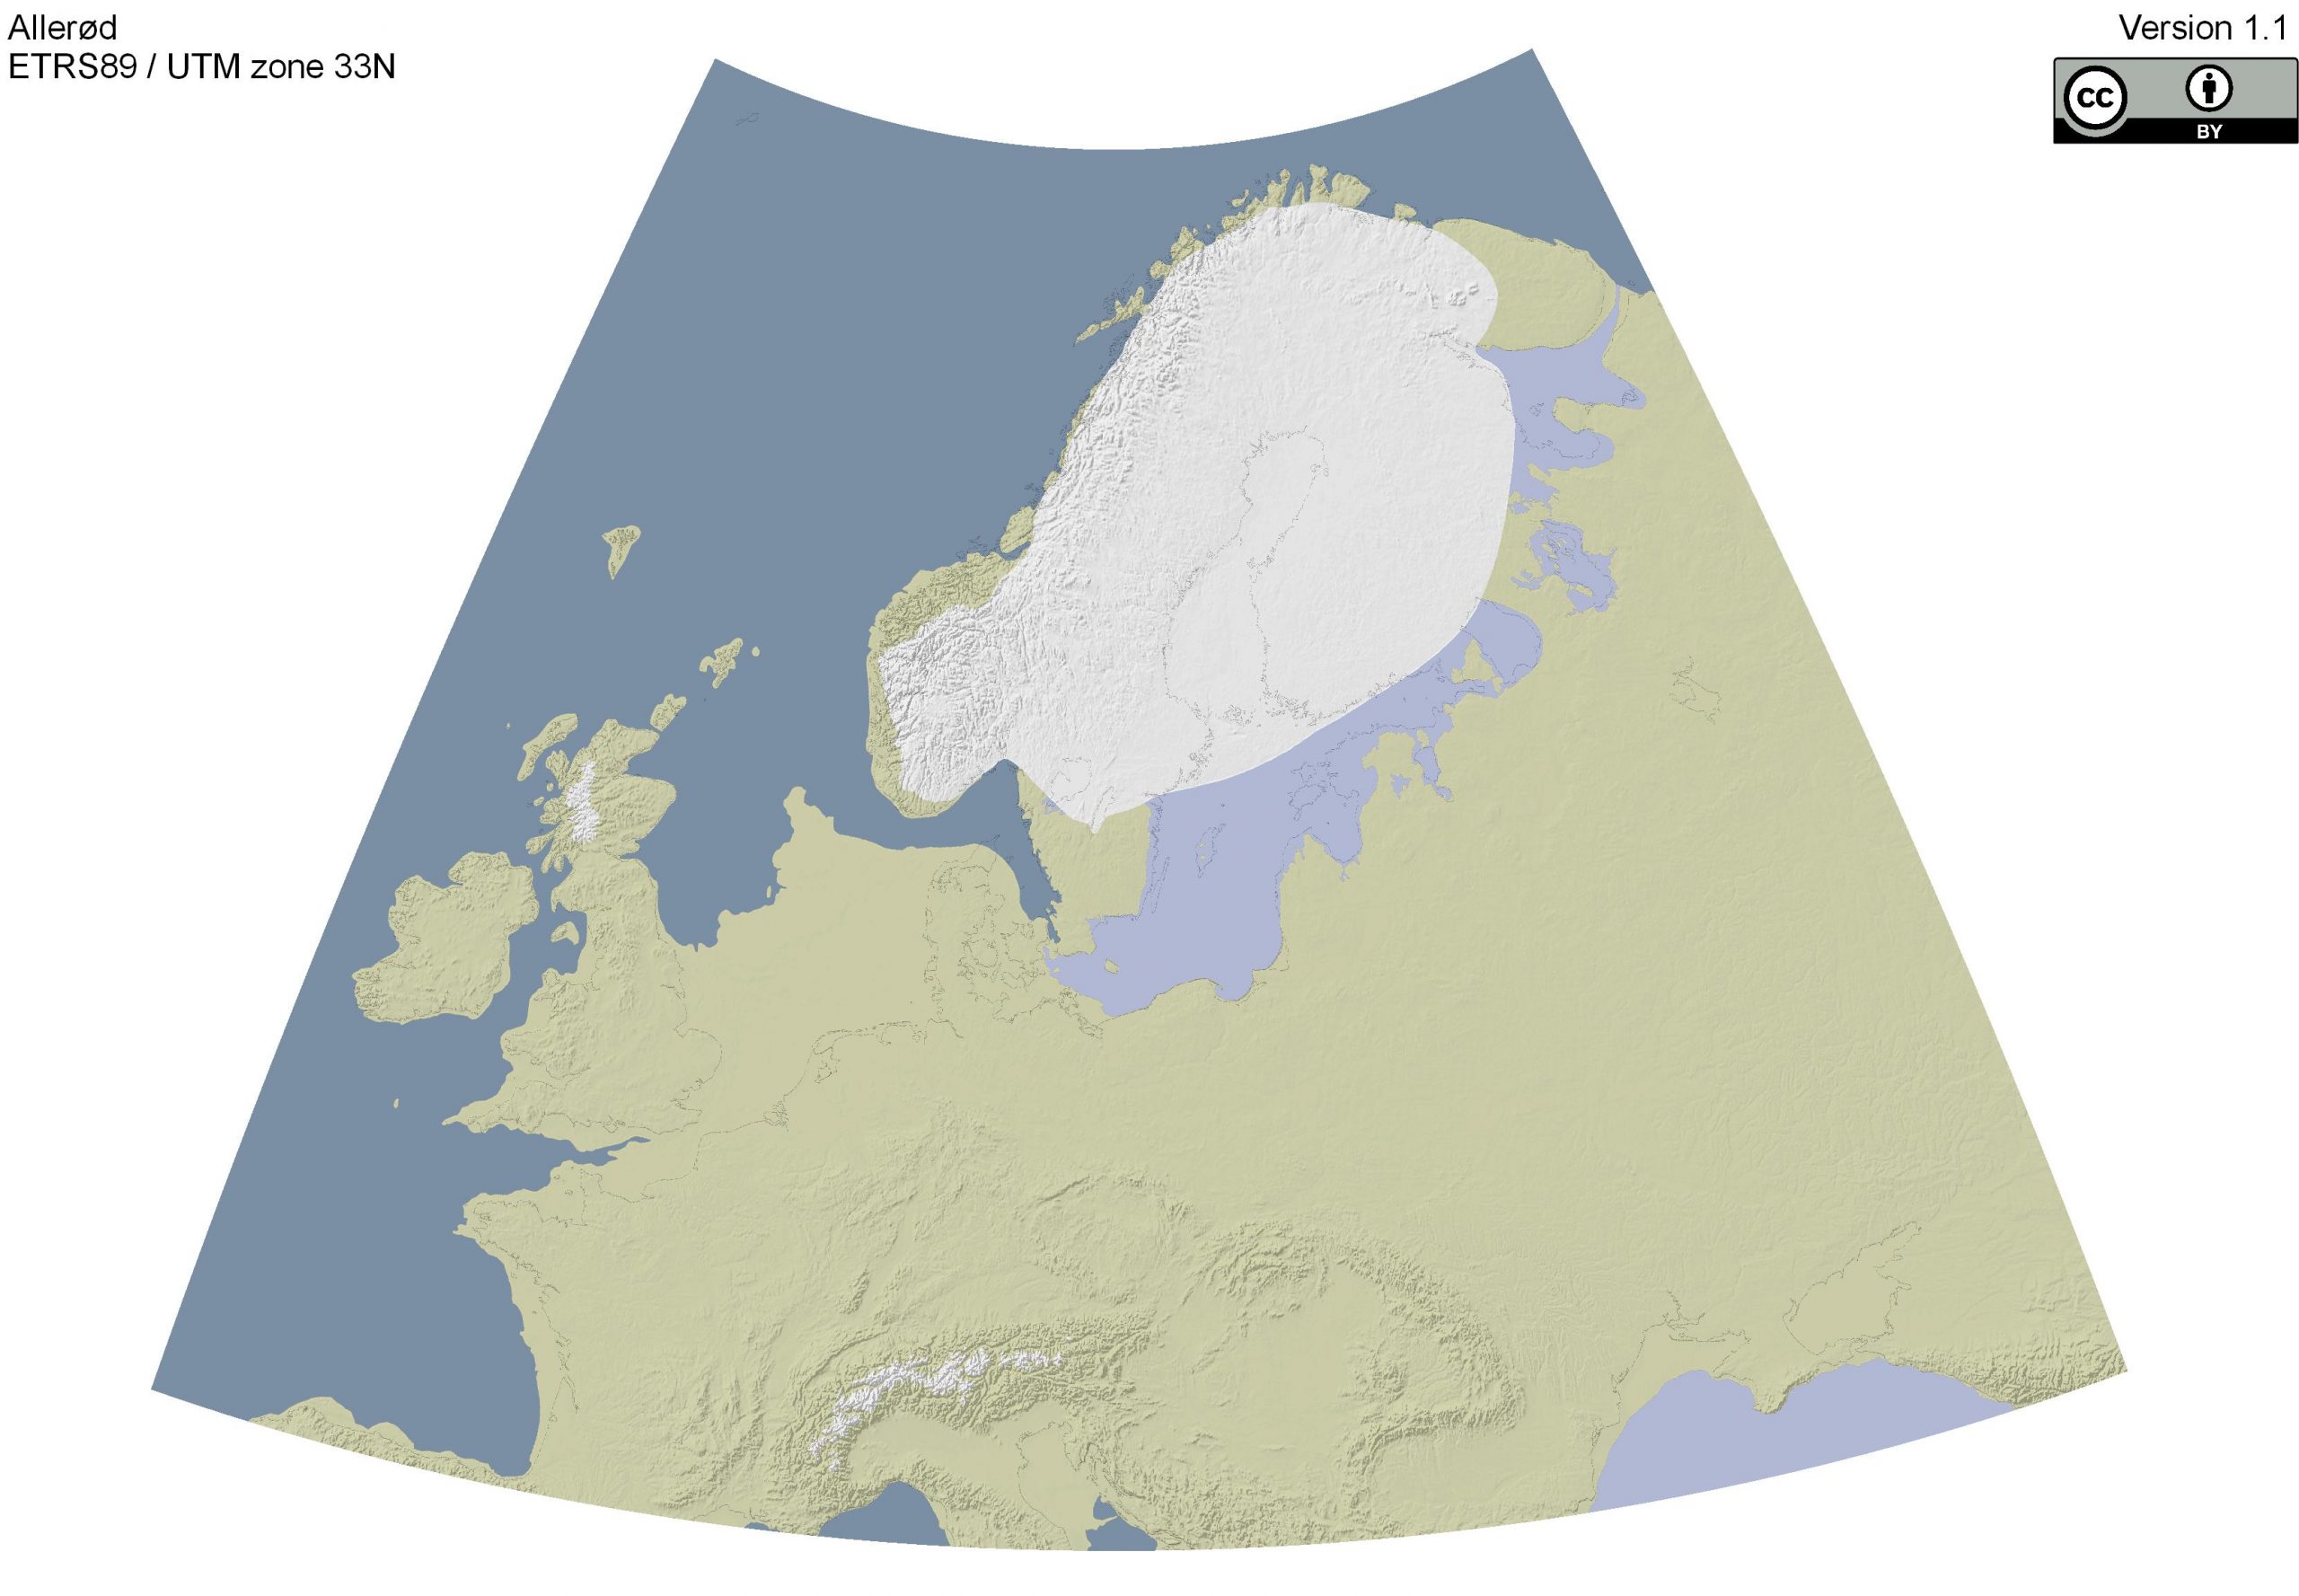
Allerød
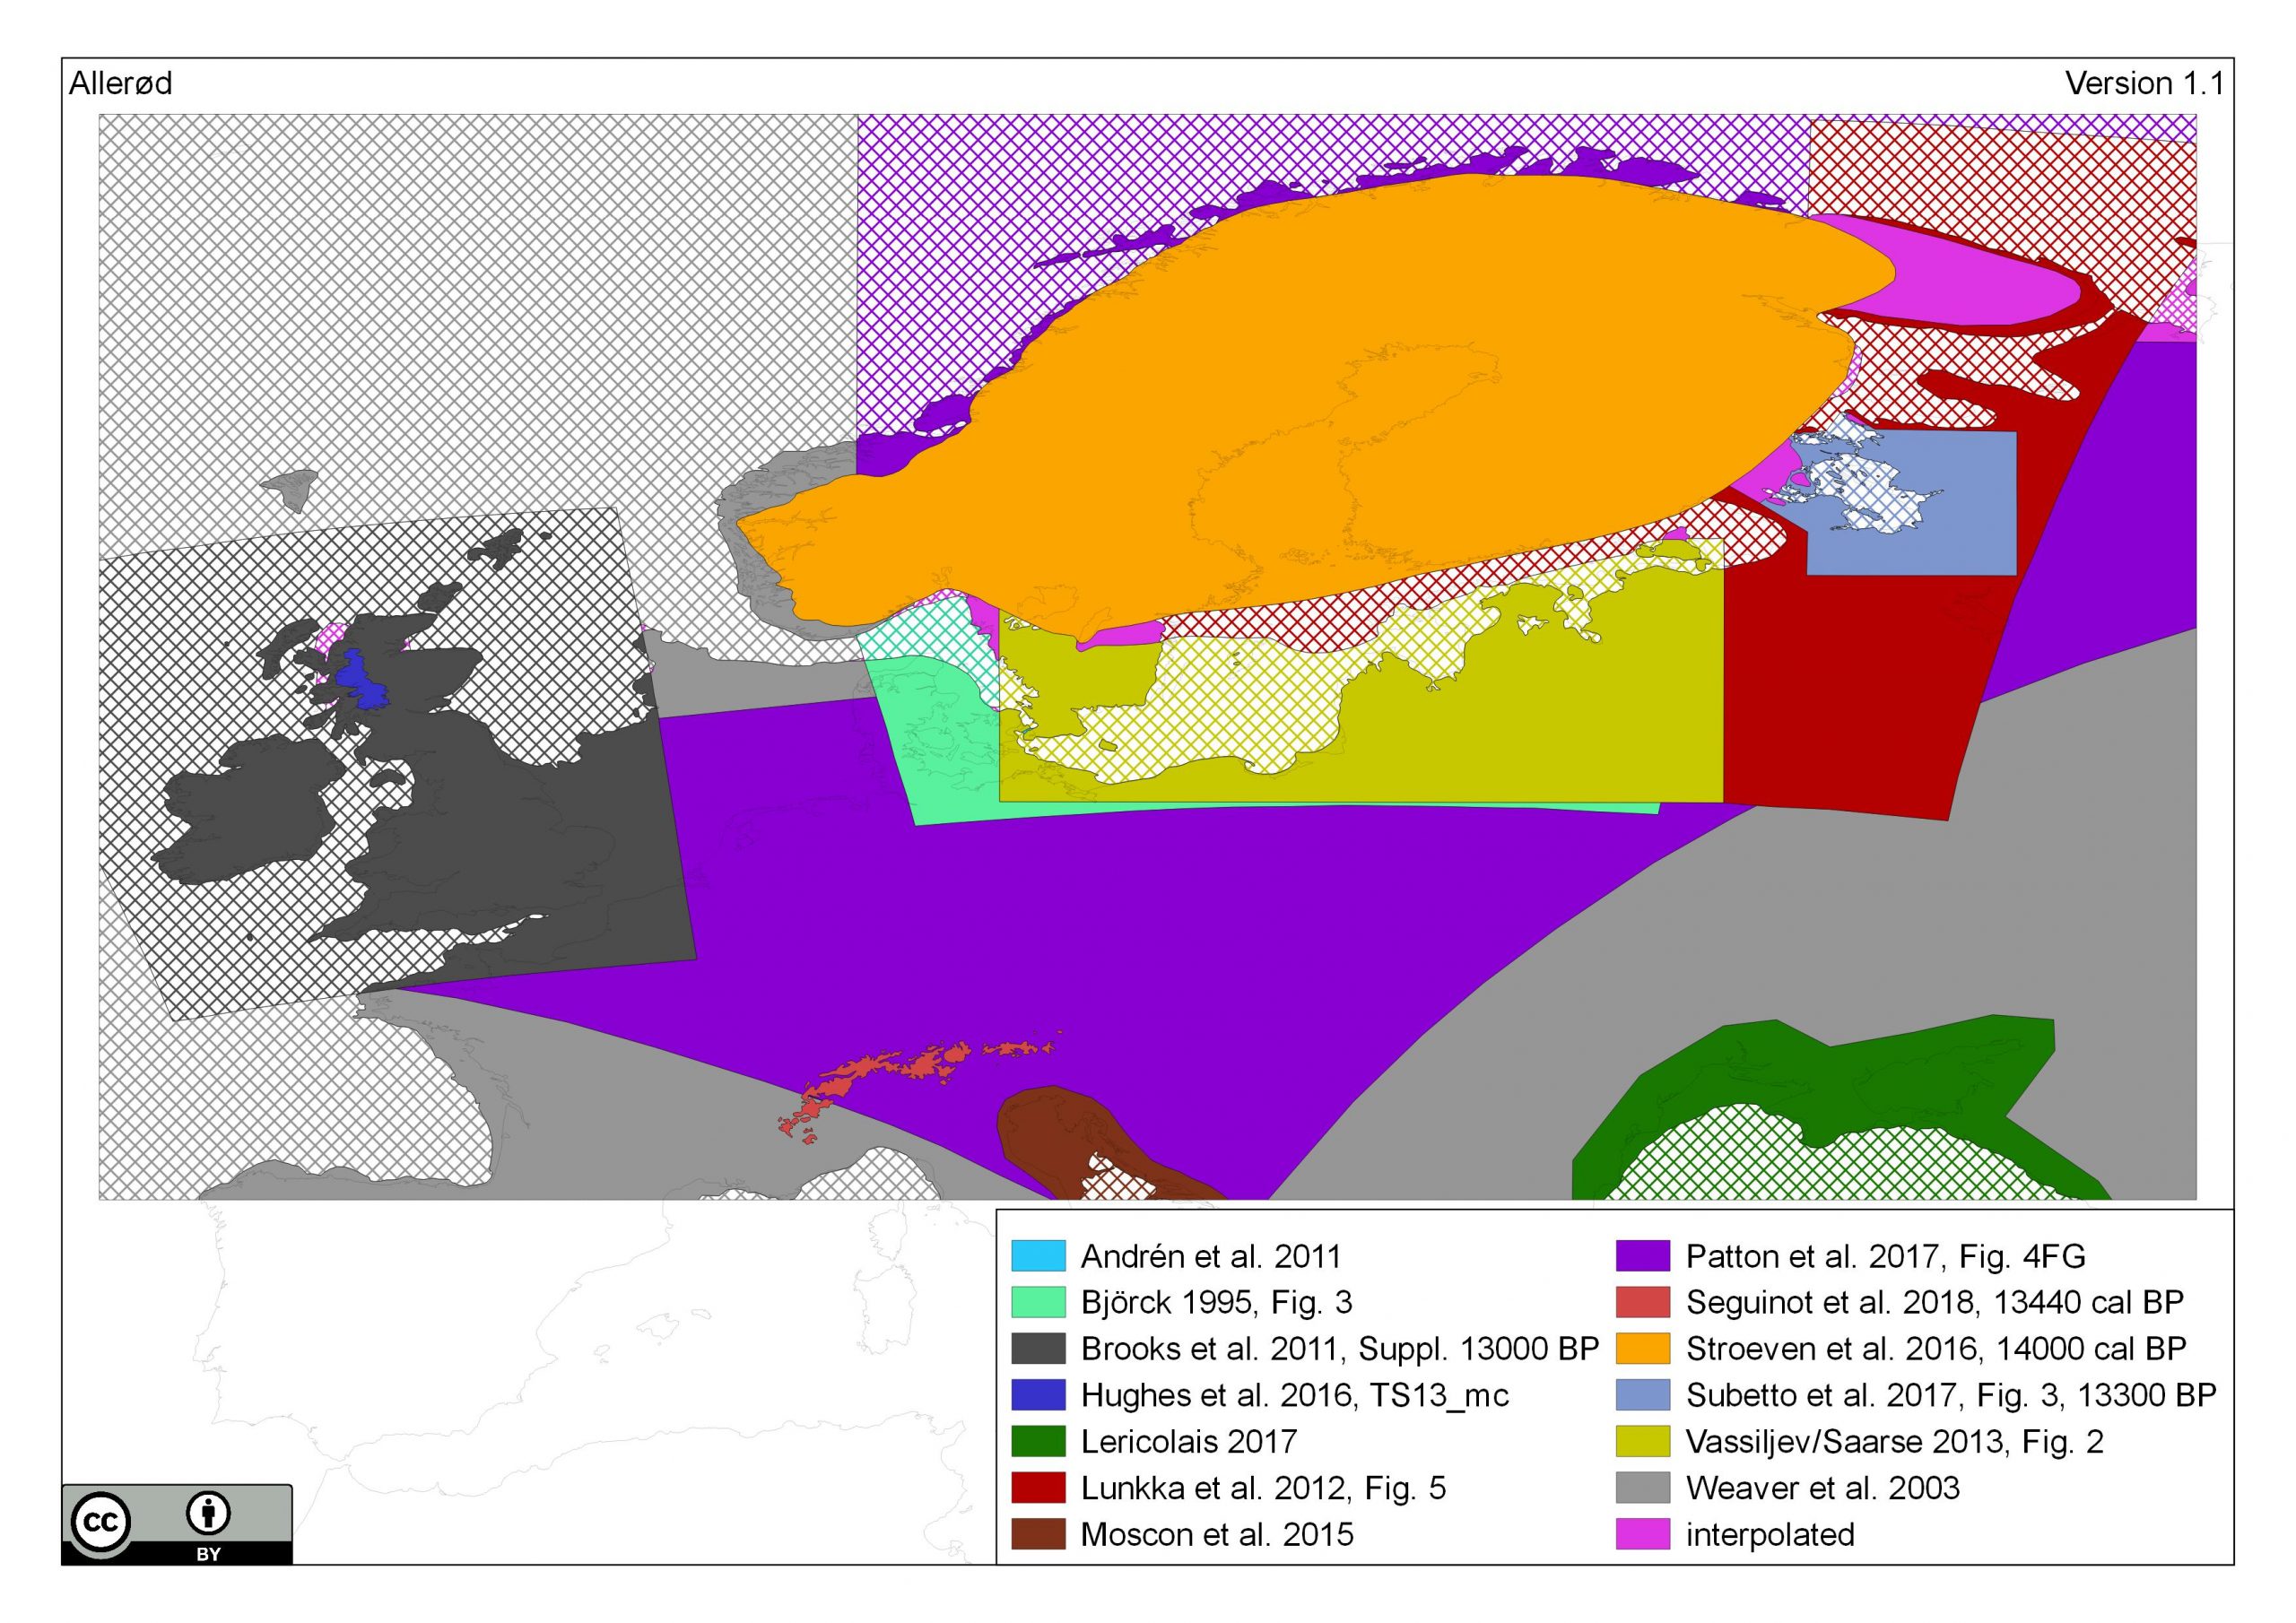
Please cite this map as „compiled by ZBSA after Andrén et al. 2011; Björck 1995; Brooks et al. 2011; Hughes et al. 2016; Lericolais 2017; Lunkka et al. 2012; Moscon et al. 2015; Patton et al. 2017; Seguinot et al. 2018; Stroeven et al. 2016; Subetto et al. 2017; Vassiljev/Saarse 2013; Weaver et al. 2003“
For full references see below.
The map is approximately representing the timeslice:
| chronological frame | timeslice |
| Greenlandic isotope chronology | GI-1c-a |
| years calibrated BC | 11950–10750 |
| year calibrated BP | 13900–12700 |
| 14C years BP | 11900–11000 |
This work is licensed under the Creative Commons Attribution 4.0 International License. To view a copy of this license, visit https://creativecommons.org/licenses/by/4.0/

The archive contains different files. A processed high resolution Geotiff in UTM 33N (1200 dpi), a processed JPG in UTM 33N (300 dpi), the raw Geotiff in WGS84, the used Source SHP File with their secondary files, the “sources map” PDF and the release notes PDF.
The processed UTM 33N Geotiff and JPG are designed for simple and direct usage, while the raw WGS84 Geotiff is for work in different map projections. The original SHP-Files are for work with alternative colour ramps or detailed insight on the used sources and specific reasons for interpolation.
This is map version 1.1. The map extend is defined from 12°W to 44°E and 43°N to 72°N. All Data were digitalised from different sources (See source map), which are listed further down on this site.
The modern coastline is derived from Natural Earth (https://www.naturalearthdata.com), large lakes were added from the “WISE Large rivers and large lakes” dataset provided by the European Environment Agency (https://www.eea.europa.eu/data-and-maps/data/wise-large-rivers-and-large-lakes). Finally the shaded elevation is calculated on the “GEBCO One Minute Grid” from the “GEBCO Gridded bathymetric Data” (https://www.gebco.net/).
The maps were produced with QGIS 3.
- Fennoscandian ice sheet data that is not corresponding with Stroeven et al. 2017 was removed and replaced by either water or land areas
- Coast lines where partially interpolated due to missing data (different ice sheet sizes), based on extrapolation from other sources
- The ice sheet shown in the maps from Brooks et al. 2011 was removed
- Sea level for the Adriatic sea was set to -70 m a.s.l. based on sea level curve from Moscon et al. 2015
- Sea level for the Black sea was set to -40 m a.s.l. based on sea level curve from Lericolais 2017
- The coastline of Mezen Bay was interpolated to fit the coastline from Lunkka et al. 2012
- The coastlines from Patton et al. 2017 where assumed as a mean of the 14.03 ka BP and 12.37 ka BP maps
- Minor adjustments were made to smoothen the coastline
| 09-08-2019 | release of Version 1.1.0 |
| 29-11-2018 | 1st release of the map |
- British Ice Sheet added after Hughes et al. 2016
- Corrected spelling (“ice sheet” instead of “ice shield”) in release notes and shape files
Andrén, T., Björck, S., Andrén, E., Conley, D., Zillén, L., Anjar, J., 2011. The development of the Baltic Sea Basin during the last 130 ka. In: Harff, J., Björck, S., Hoth, P. (Eds.), The Baltic Sea Basin. Central and Eastern European Development Studies (CEEDES) 5, Springer, Berlin, Heidelberg, pp. 75-97
Björck, S. 1995. A review of the history of the Baltic Sea, 13.0-8.0 ka BP. Quaternary International 27, 19–40.
Brooks, A. J., Bradley, S. L., Edwards, R. J. and Goodwyn, N. 2011. The palaeogeography of Northwest Europe during the last 20,000 years. Journal of Maps 7, 573-587.
Hughes A. L. C., Gyllencreutz, R., Lohne, Ø. S., Mangerud, J., Svendsen, J. I. 2016, The last Eurasian ice sheets – a chronological database and time-slice reconstruction, DATED-1. Boreas 45, 1–45
Lericolais, G., 2017. Late Pleistocene Environmental Factors defining the Black Sea, and Submerged Landscapes on the Western Continental Shelf, Submerged Landscapes of the European Continental Shelf, John Wiley & Sons, Ltd, pp. 479-495.
Lunkka, J.-P., Putkinen, N., Miettinen, A., 2012. Shoreline displacement in the Belomorsk area, NW Russia during the Younger Dryas Stadial. Quaternary Science Reviews 37, 26-37.
Moscon, G., Corregiari, A., Stefani, C., Fontana, A. and Remia, A. 2015. Very-high resolution analysis of a transgessive deposit in the Northern Adriactic sea (Italy). Alpine and Mediterranean Quaternary 28, 121-129.
Patton, H., Hubbard, A., Andreassen, K., Auriac, A., Whitehouse, P.L., Stroeven, A.P., Shackleton, C., Winsborrow, M., Heyman, J., Hall, A.M., 2017. Deglaciation of the Eurasian ice sheet complex. Quaternary Science Reviews 169, 148-172.
Seguinot, J., Ivy-Ochs, S., Jouvet, G., Huss, M., Funk, M., Preusser, F., 2018. Modelling last glacial cycle ice dynamics in the Alps. The Cryosphere 12, 3265-3285.
Stroeven, A.P., Hättestrand, C., Kleman, J., Heyman, J., Fabel, D., Fredin, O., Goodfellow, B.W., Harbor, J.M., Jansen, J.D., Olsen, L., Caffee, M.W., Fink, D., Lundqvist, J., Rosqvist, G.C., Strömberg, B., Jansson, K.N., 2016. Deglaciation of Fennoscandia. Quaternary Science Reviews 147, 91-121.
Subetto, D., Zobkov, M., Potakhin, M., Tarasov, A., 2017. Paleoreconstructions of Lake Onego. Development in the Late Pleistocene and Holocene.
Vassiljev, J., Saarse, L., 2013. Timing of the Baltic Ice Lake in the eastern Baltic. Bulletin of the Geological Society of Finland 85, 9-18.
Weaver, A.J., Saenko, O.A., Clark, P.U., Mitrovica, J.X., 2003. Meltwater Pulse 1A from Antarctica as a Trigger of the Bølling-Allerød Warm Interval. Science 299, 1709-1713.