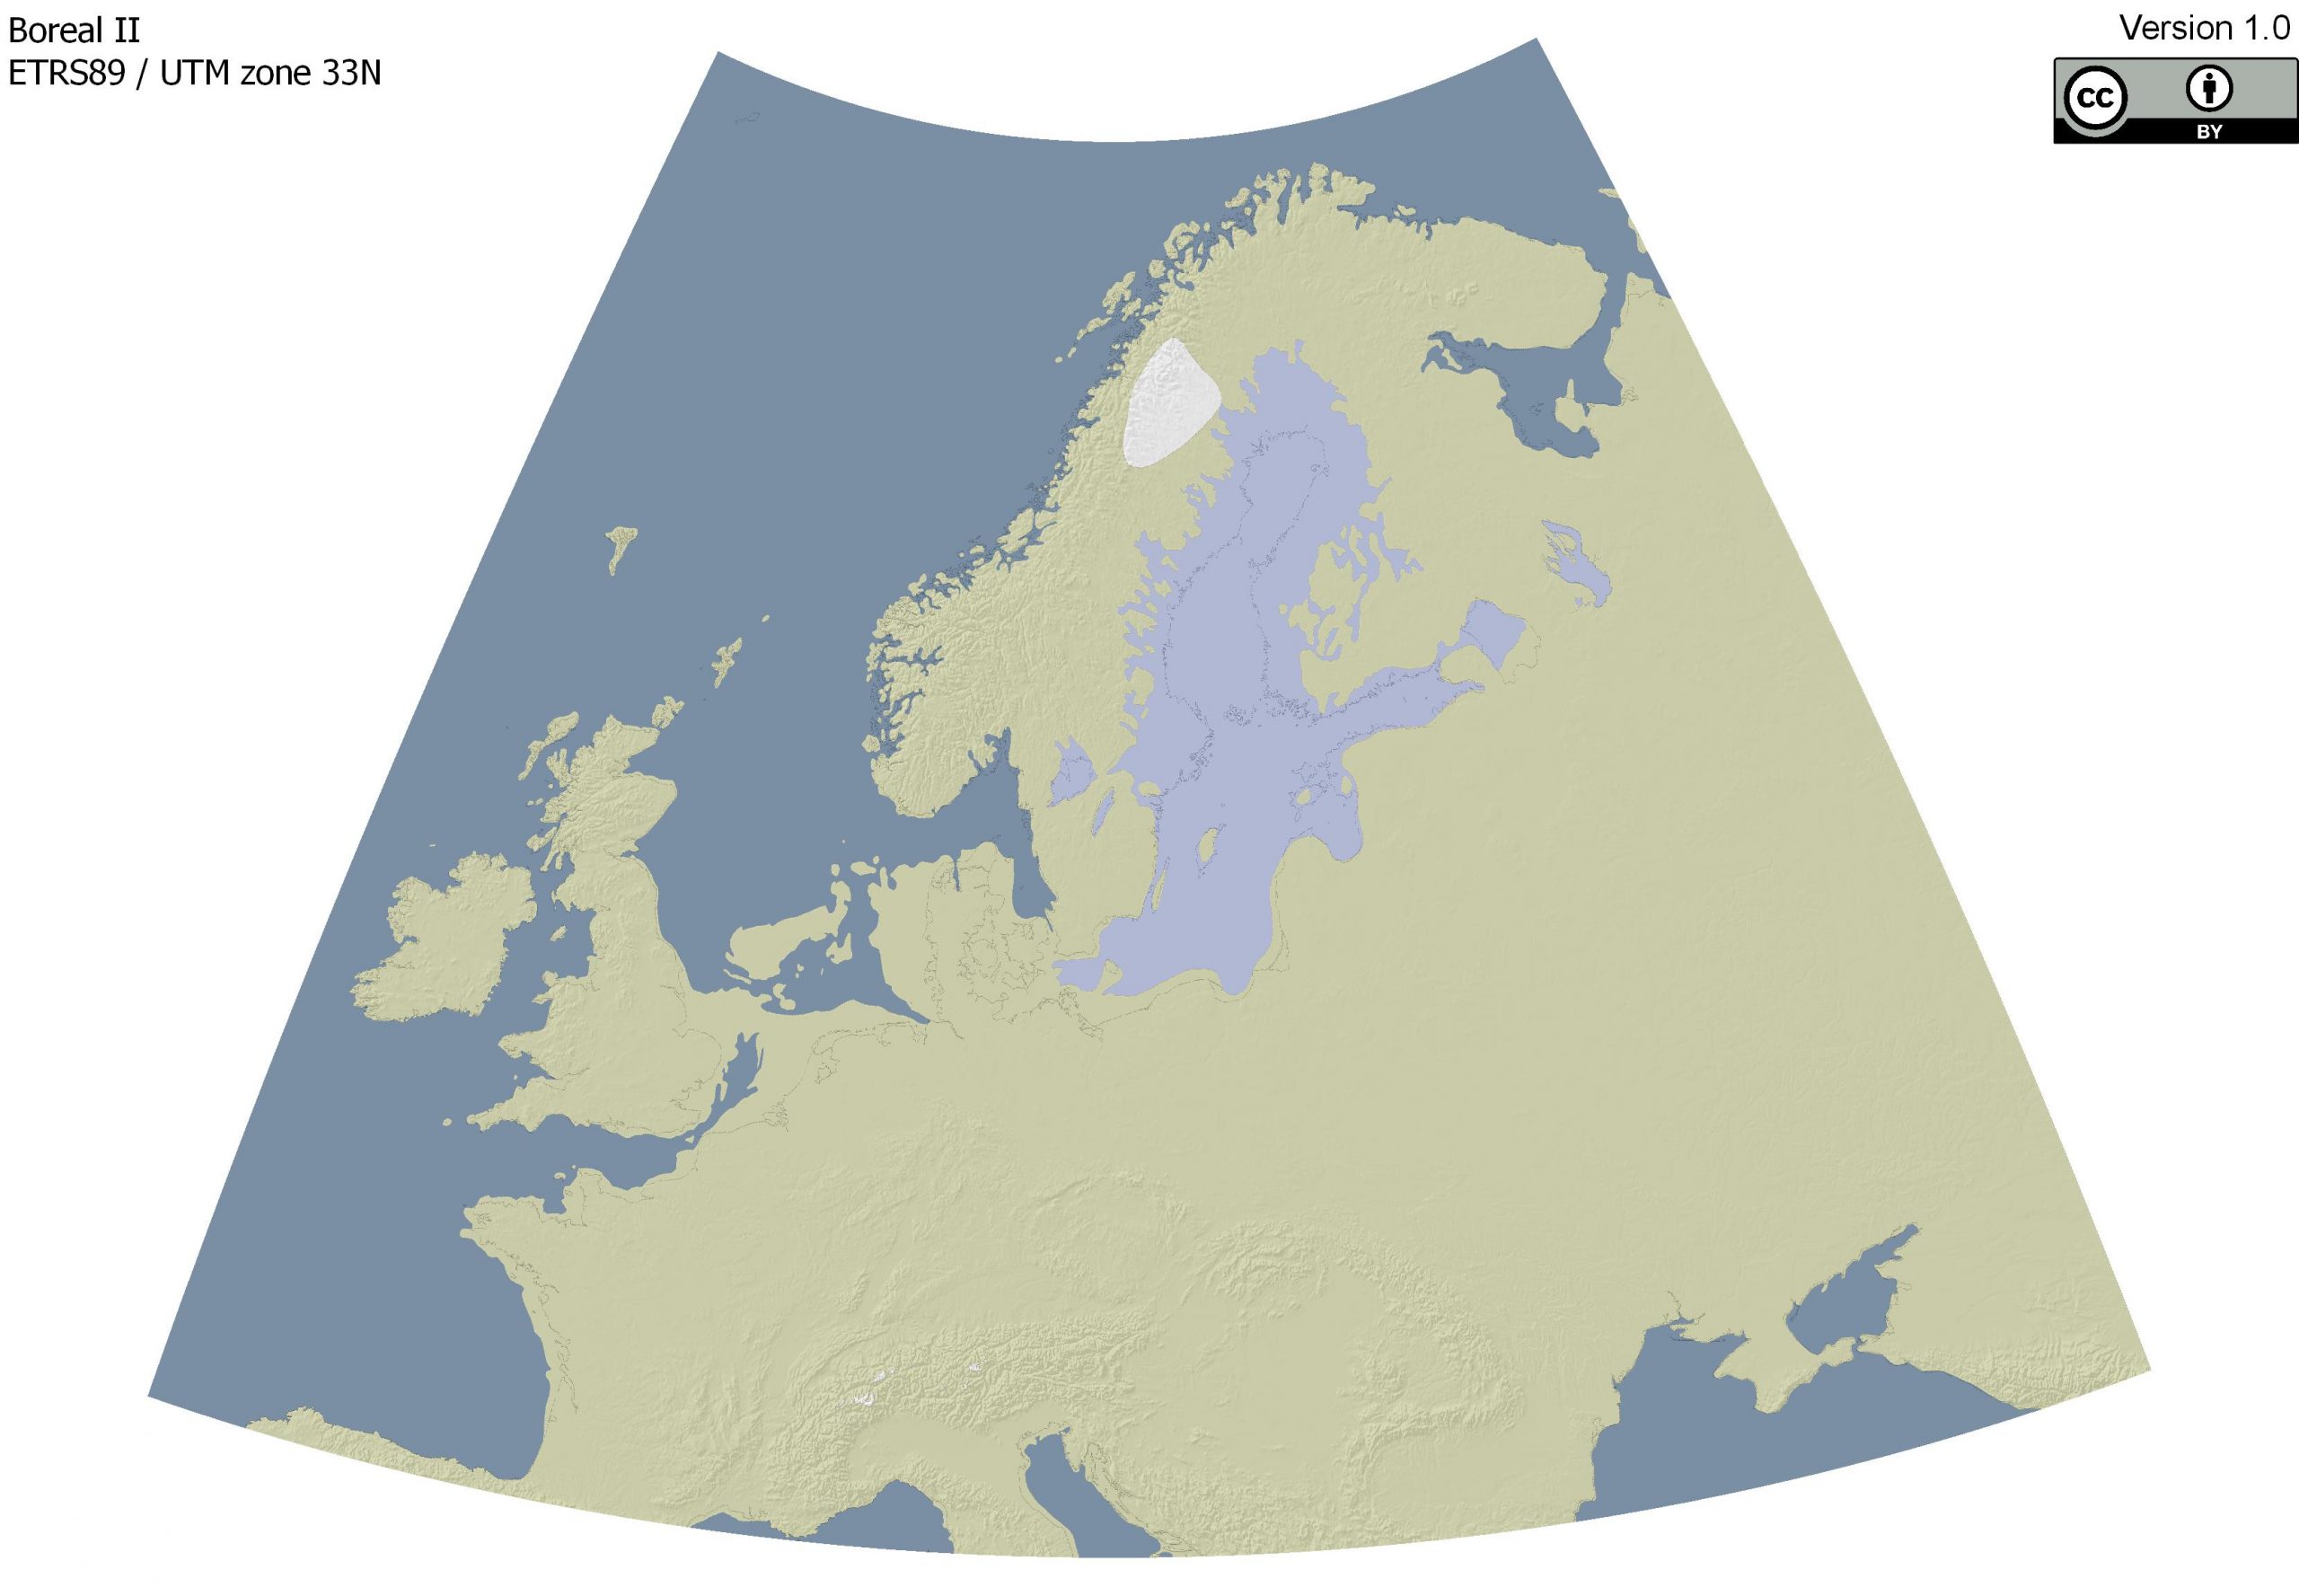
Late Boreal
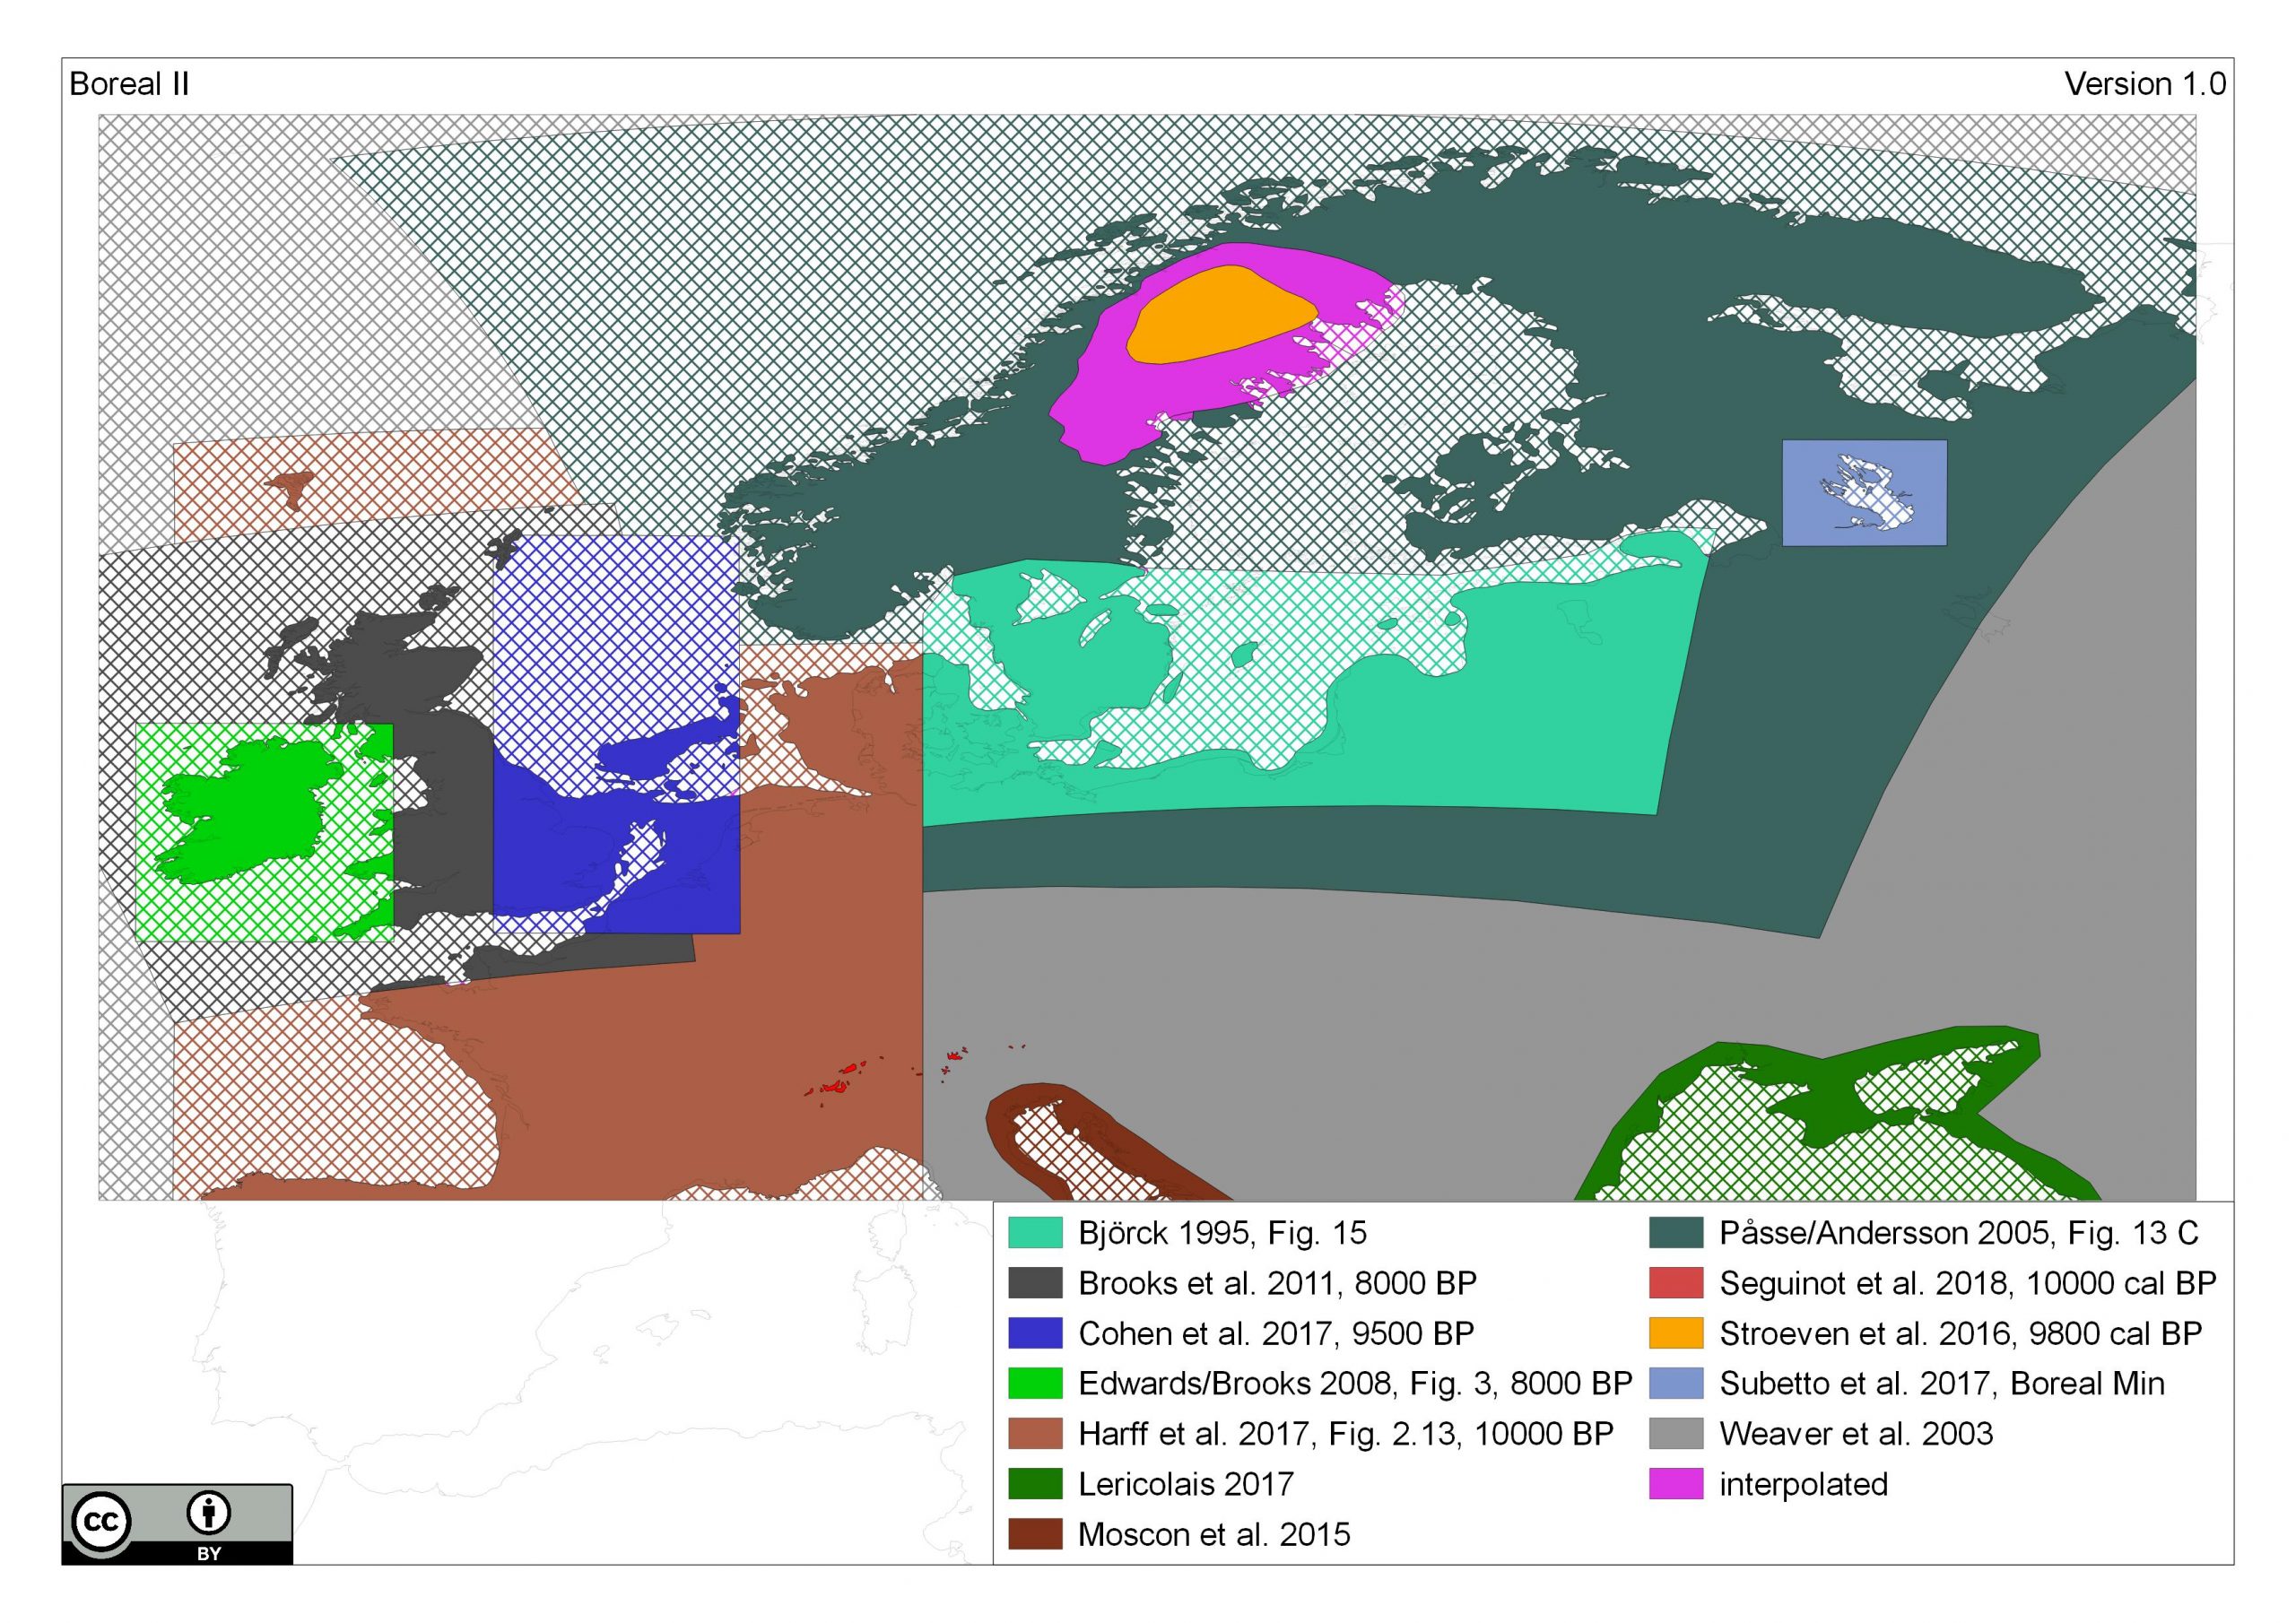
Please cite this map as „compiled by ZBSA after Björck 1995; Brooks et al. 2011; Cohen et al. 2017; Edwards/Brooks 2008; Harff et al. 2017; Lericolais 2017; Moscon et al. 2015; Påsse/Andersson 2005; Seguinot et al. 2018; Stroeven et al. 2016; Subetto et al. 2017; Weaver et al. 2003“
For full references see below.
The map is approximately representing the timeslice:
| chronological frame | timeslice |
| Greenlandic isotope chronology | – |
| years calibrated BC | 8000–7200 |
| year calibrated BP | 10000–9200 |
| 14C years BP | 8800–8500 |
This work is licensed under the Creative Commons Attribution 4.0 International License. To view a copy of this license, visit https://creativecommons.org/licenses/by/4.0/

The archive contains different files. A processed high resolution Geotiff in UTM 33N (1200 dpi), a processed JPG in UTM 33N (300 dpi), the raw Geotiff in WGS84, the used Source SHP File with their secondary files, the “sources map” PDF and the release notes PDF.
The processed UTM 33N Geotiff and JPG are designed for simple and direct usage, while the raw WGS84 Geotiff is for work in different map projections. The original SHP-Files are for work with alternative colour ramps or detailed insight on the used sources and specific reasons for interpolation.
This is map version 1.0. The map extend is defined from 12°W to 44°E and 43°N to 72°N. All Data were digitalised from different sources (See sources map) which are listed further down on this site.
The modern coastline is derived from Natural Earth (https://www.naturalearthdata.com), large lakes were added from the “WISE Large rivers and large lakes” dataset provided by the European Environment Agency (https://www.eea.europa.eu/data-and-maps/data/wise-large-rivers-and-large-lakes). Finally the shaded elevation is calculated on the “GEBCO One Minute Grid” from the “GEBCO Gridded bathymetric Data” (https://www.gebco.net/).
The maps were produced with QGIS 3.
- Fennoscandian ice sheet data that is not corresponding with Stroeven et al. 2017 was removed and replaced by either water or land areas
- The interpolation of the Swedish coastline is approximated on steps between 280 m a.s.l. (most southern part of interpolated area) to 220 m a.s.l. (most northern part of interpolated area)
- Sea level for the Adriatic sea was set to -20 m a.s.l. based on sea level curve from Moscon et al. 2015
- Sea level for the Black sea was set to -2 m a.s.l. based on sea level curve from Lericolais2017
- Minor adjustments were made to smoothen the coastline
| 09-08-2019 | release of Version 1.0.1 |
| 29-11-2018 | 1st release of the map |
- Corrected spelling („ice sheet“ instead of „ice shield“) in release notes and shape files
Björck, S. 1995. A review of the history of the Baltic Sea, 13.0-8.0 ka BP. Quaternary International 27, 19–40.
Brooks, A. J., Bradley, S. L., Edwards, R. J. and Goodwyn, N. 2011. The palaeogeography of Northwest Europe during the last 20,000 years. . Journal of Maps 7, 573-587.
Cohen, K. M., Westley, K., Erkens, G., Hijma, M. P. and Weerts, H. J. T. 2017: The North Sea. Submerged Landscapes of the European Continental Shelf: John Wiley & Sons, Ltd, 147-186.
Edwards, R., Brooks, E., 2008. The Island of Ireland: Drowning the Myth of an Irish Land-bridge?, In: Davenport, J.J., Sleeman, D.P., Woodman, P.C. (Eds.), Mind the Gap: Postglacial Colonisa, pp. 19-34.
Harff, J., Flemming, N. C., Groh, A., Hünicke, B., Lericolais, G., Meschede, M., Rosentau, A., Sakellariou, D., Uścinowicz, S., Zhang, W. and Zorita, E. 2017: Sea Level and Climate. In Flemming, N. C., Harff, J., Moura, D., Burgess, A. and Bailey, G. N., editors, Submerged Landscapes of the European Continental Shelf, Hoboken, NJ: Wiley & Sons, 11-49.
Lericolais, G., 2017. Late Pleistocene Environmental Factors defining the Black Sea, and Submerged Landscapes on the Western Continental Shelf, Submerged Landscapes of the European Continental Shelf, John Wiley & Sons, Ltd, pp. 479-495.
Moscon, G., Corregiari, A., Stefani, C., Fontana, A. and Remia, A. 2015. Very-high resolution analysis of a transgessive deposit in the Northern Adriactic sea (Italy). Alpine and Mediterranean Quaternary 28, 121-129.
Påsse, T., Andersson, L., 2005. Shore-level displacement in Fennoscandia calculated from empirical data. Gff 127, 253-268.
Seguinot, J., Ivy-Ochs, S., Jouvet, G., Huss, M., Funk, M., Preusser, F., 2018. Modelling last glacial cycle ice dynamics in the Alps. The Cryosphere 12, 3265-3285.
Stroeven, A.P., Hättestrand, C., Kleman, J., Heyman, J., Fabel, D., Fredin, O., Goodfellow, B.W., Harbor, J.M., Jansen, J.D., Olsen, L., Caffee, M.W., Fink, D., Lundqvist, J., Rosqvist, G.C., Strömberg, B., Jansson, K.N., 2016. Deglaciation of Fennoscandia. Quaternary Science Reviews 147, 91-121.
Subetto, D., Zobkov, M., Potakhin, M., Tarasov, A., 2017. Paleoreconstructions of Lake Onego. Development in the Late Pleistocene and Holocene.
Weaver, A.J., Saenko, O.A., Clark, P.U., Mitrovica, J.X., 2003. Meltwater Pulse 1A from Antarctica as a Trigger of the Bølling-Allerød Warm Interval. Science 299, 1709-1713.